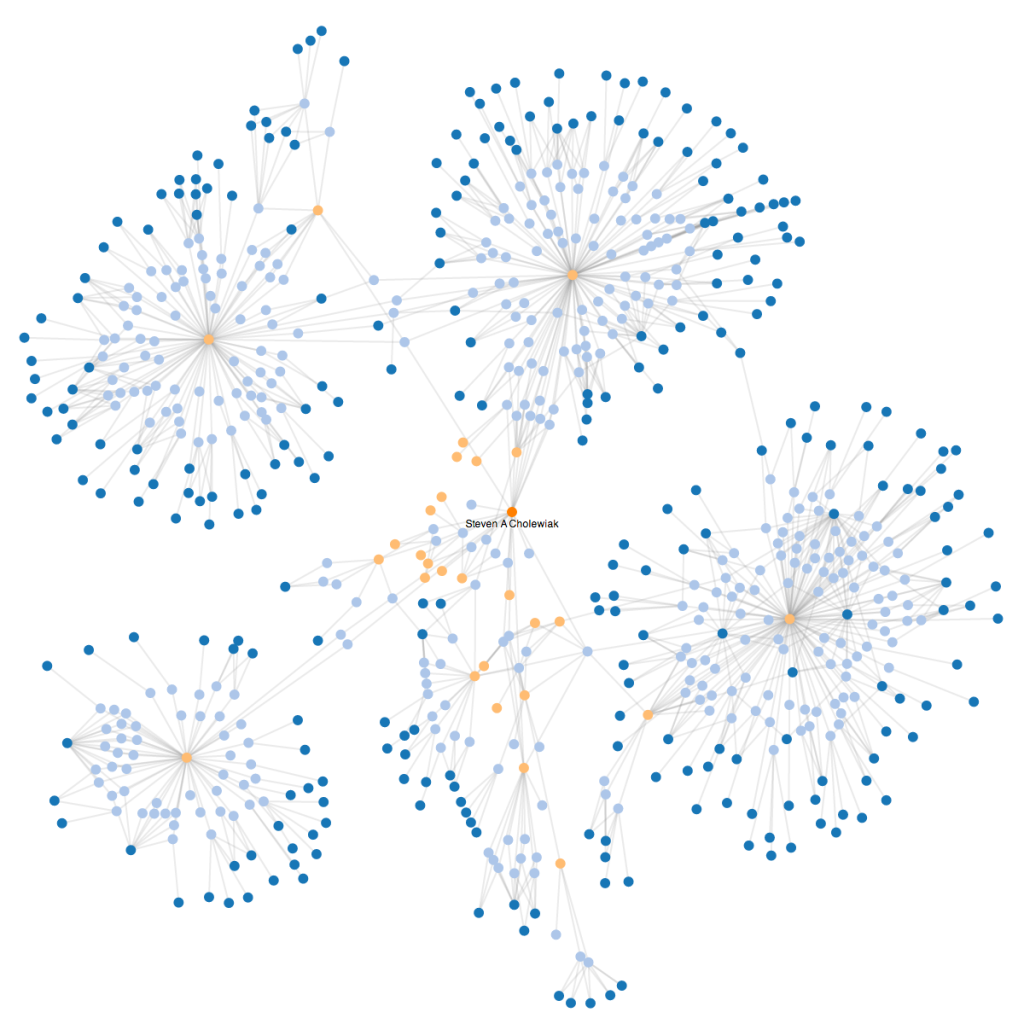
Another post, another neat force-directed graph. This one illustrates the interconnections between professors and students who have been co-authors on some of my papers and presentations, as scrapped from Google Scholar citations. It could be described as the first version of a rough illustration of my 2 degrees of separation in academia.

The dark orange circle in the center is myself, light blue circles are papers/presentations, light orange circles are co-authors, and dark-blue circles are co-authors of my co-authors (i.e., have not necessarily directly worked with me on a project).
Unfortunately, as of today, not all of my co-authors have Google Scholar pages, so there are a number of co-authors whose connections and branches are under-represented. In addition, Google Scholar does not necessarily accumulate all of a given author’s papers/presentations and often makes mistakes misattributing papers to profiles. So, the veracity of the information represented here should be taken with a grain of salt unless I find a better service for generating these networks.
For some more information on how this was created, click-through to the post.
As with the VSS DNA graph I made before the Visual Sciences Society Annual Meeting this past May, I used Python, NetworkX, and D3.js. In addition, I took advantage of another Python module, GoogleScholar, to screen-scrape information from the Google Scholar profiles.
Starting with my Google Scholar citation profile, I loop through the individual entries and extract the titles and co-authors of each entry. The names and titles are connected as nodes using NetworkX. I then had a list of co-authors:
- Ari Weinstein
- Benjamin Kunsberg
- Bernard D Adelstein
- Bina Pastakia
- Chia-Chien Wu
- Chris L Baker
- David S Ebert
- E Daniel Hirleman
- Flip Phillips
- Gaurav Kharkwal
- Hong Z Tan
- Jacob Feldman
- Joshua B Tenenbaum
- Julia E. Mazzarella
- Kevin Sanik
- Kristina Denisova
- Kwangtaek Kim
- Manish Singh
- Matthew B Kocsis
- Melissa M Kibbe
- Paul Ringstad
- Peter C Pantelis
- Roger W. Cholewiak
- Roland W Fleming
- Ryan M Traylor
- Steven W Zucker
- Sung-Ho Kim
- Tim Gerstner
To create the connections, I search for the co-authors names on Google Scholar (the profiles that were used are linked above) and do the same thing, extracting the titles and (co-?)co-authors names. This allowed me to produce a network diagram illustrating individuals who have been my co-authors, along with co-authors of those co-authors. Many of my co-authors did not have profiles when I generated this first version and there were a few with technical problems (e.g., one profile was populated with a large number of papers from another individual with the same name as my co-author, but a different person, and pruning these problematic entries would have been labor intensive). Still, it is a neat illustration worth sharing.
I am not currently including the code on this page because it is quite messy and “non-pythonic”, but I’m happy to share it if there is interest. In addition, since this image was produced with D3.js, there is an interactive version of the graph available. I chose not to include it because it can be quite computationally taxing with the large number of nodes and connections and therefore not the best for directly including on the blog.
UPDATE June 20, 2014: I removed the co-author labels from the lead image because I don’t want to give the false impression that specific co-authors are better connected than others. Since this visualization is dependent on a 3rd party scraping service, it is problematic to draw any conclusions about “connectedness” from this representation.