2 Degrees of Academic Separation using Google Scholar v1

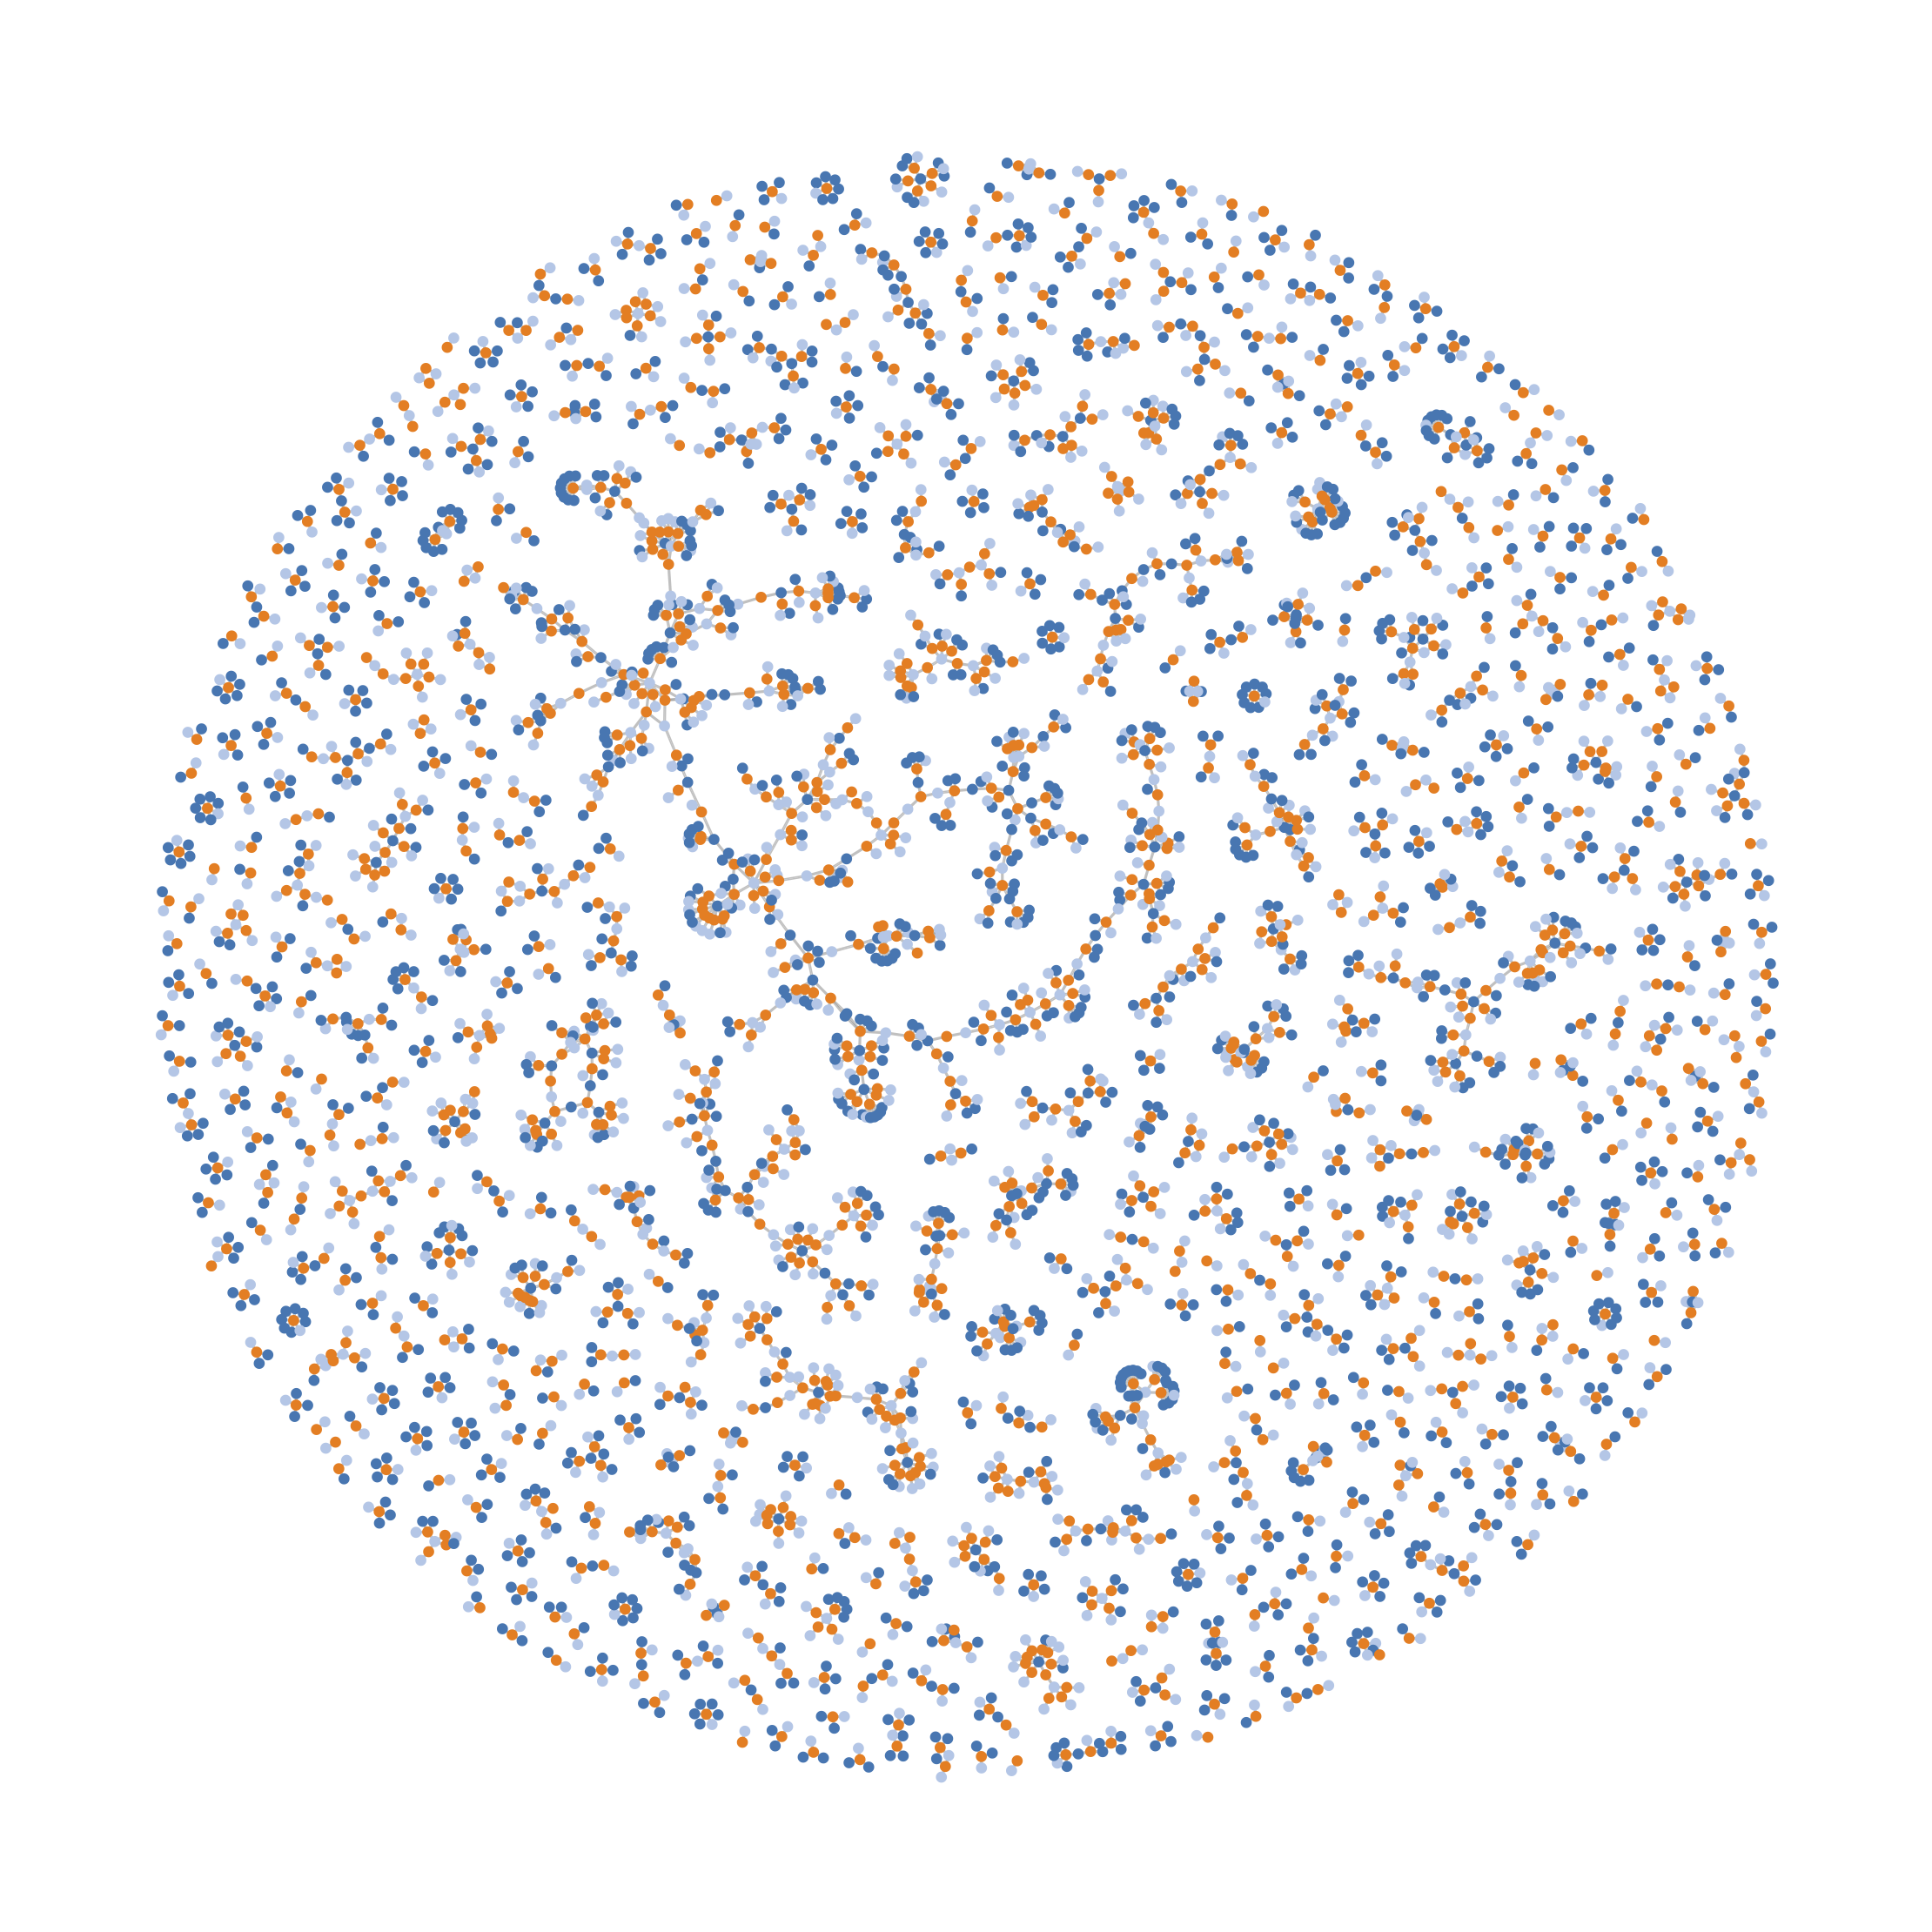
Another post, another neat force-directed graph. This one illustrates the interconnections between professors and students who have been co-authors on some of my papers and presentations, as scrapped from Google Scholar citations.  It could be described as the first version of a rough illustration of my 2 degrees of separation in academia.

2-Degrees-of-Academic-Seperation-v1.1

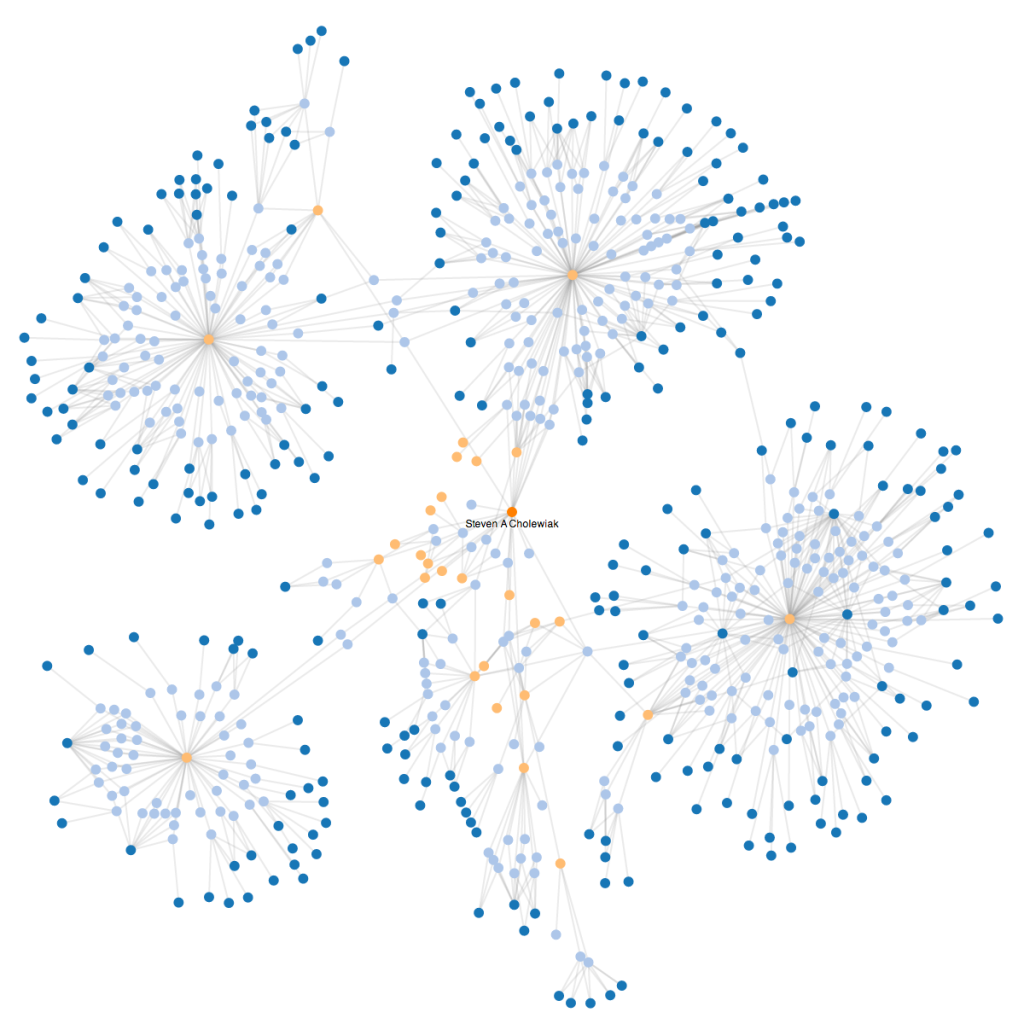
The dark orange circle in the center is myself, light blue circles are papers/presentations, light orange circles are co-authors, and dark-blue circles are co-authors of my co-authors (i.e., have not necessarily directly worked with me on a project).

Unfortunately, as of today, not all of my co-authors have Google Scholar pages, so there are a number of co-authors whose connections and branches are under-represented.  In addition, Google Scholar does not necessarily accumulate all of a given author’s papers/presentations and often makes mistakes misattributing papers to profiles.  So, the veracity of the information represented here should be taken with a grain of salt unless I find a better service for generating these networks.

For some more information on how this was created, click-through to the post.

Read More

VSS 2014 “DNA” v1

Here’s an illustration I pulled together using Python, NetworkX, and D3.js to illustrate the interconnections between abstracts that will be presented at the Vision Sciences Society 2014 annual meeting in approximately 2 weeks. Orange dots represent abstracts, Light Blue dots represent authors with at least one first authorship, and Dark Blue dots represent other authors (second through last).

VSS DNA v1

As you can see, there are large numbers of abstracts that have few shared authors.  Those abstracts that share authors often join together to create “chains” of students, advisors, and colleagues.

This is a first version, hastily pulled together, so there are a few problems.  The nodes are assigned to authors by name, which can be a problem for authors sharing the same name (which creates more connections than appropriate for a given node) or who  have inconsistent reporting of their name (for example, omitting the middle initial or alternate spelling, which can create another erroneous node). I am thinking of addressing the duplicate node issue by using a string similarity metric (e.g., Levenshtein distance) to find strings that contain similar names to combine the connections, but this could be an issue if the names are truly different people. Alternatively, I could incorporate the authors’ affiliations, but this carries similar issues (e.g., I report my affiliation as “University of Giessen” while colleagues report it as “Justus-Liebig-Universität Gießen”).

Although there are lingering issues, it is still an interesting illustration of the connections between the different abstracts being presented at VSS 2014.

Here’s the code on GitHub: visvssrelationships

Preparing a “Blobby” Object for Printing with Shapeways

I have been working with a 3D blobby object for some of my pilot studies on shape from shading and texture that I would like to 3D print. Back at Rutgers University, we had a MakerBot Cupcake, but now that I am in Germany, I need to find alternatives. I have been looking into getting the 3D object printed using Shapeways.com but there have been a few hiccups along the way, so I wanted to describe my experiences in the hopes that it might help someone else avoid these issues in the future. The object was generated in MATLAB using a simple script (see 3D “Potato” Generation using Sinusoidal Pertubations) and rendered in our 3D environment:

3D-Blobby-Object---Solid-(Seed--0431630057)

So the question is: What do I need to do to get this 3D object printed at Shapeways? Click through to see the steps that I took to get this 3D model printed economically.
Read More

Orientation Fields of a Rotating “Blobby” Object

In research I will be presenting in a few days at VSS (the Vision Sciences Society annual meeting), I will be demonstrating how we may use orientation flow fields of texture and shading when making perceptual judgments of 3D shape structure (see Fleming, Holtmann-Rice, & Bülthoff, 2011 for additional information). Since I find visualizations fun, I decided to use some spare CPU cycles overnight to visualize the orientation fields of a rotating blobby object.


The object on the left in the above video is a textured and shaded object with a small amount of specular reflection (lit using the Debvec Funston Beach at Sunset light probe). On the right, I’m illustrating the dominant orientations in the image, across the surface of the object.

Click through for some more visualizations.
Read More

Visual perception of the physical stability of asymmetric three-dimensional objects

I recently published an article in the Journal of Vision with my PhD advisor, Manish Singh, and my current Postdoctoral advisor, Roland W. Fleming:

Here’s the abstract:

Visual estimation of object stability is an ecologically important judgment that allows observers to predict the physical behavior of objects. A natural method that has been used in previous work to measure perceived object stability is the estimation of perceived “critical angle”—the angle at which an object appears equally likely to fall over versus return to its upright stable position. For an asymmetric object, however, the critical angle is not a single value, but varies with the direction in which the object is tilted. The current study addressed two questions: (a) Can observers reliably track the change in critical angle as a function of tilt direction? (b) How do they visually estimate the overall stability of an object, given the different critical angles in various directions? To address these questions, we employed two experimental tasks using simple asymmetric 3D objects (skewed conical frustums): settings of critical angle in different directions relative to the intrinsic skew of the 3D object (Experiment 1), and stability matching across 3D objects with different shapes (Experiments 2 and 3). Our results showed that (a) observers can perceptually track the varying critical angle in different directions quite well; and (b) their estimates of overall object stability are strongly biased toward the minimum critical angle (i.e., the critical angle in the least stable direction). Moreover, the fact that observers can reliably match perceived object stability across 3D objects with different shapes suggests that perceived stability is likely to be represented along a single dimension.

Want to cite us? Click through for the BibTeX source.
Read More

Effect of Environment Map Blur on Perceived Surface Properties

Here are a couple of quick demos, illustrating how blurring a cubic environmental map can lead to a change in the perceived roughness of the surface of 3D rendered objects.


I created a series of HDR cube maps using NVIDIA’s CubeMapGen (currently hosted on Google Code). Starting with the Debevec light probes, I applied a Gaussian blur with increasing kernel size (10°, 20°, 30°, 40°, and 50°), creating 6 cube maps (one for each blur). In the videos, the cube maps have increasing blur from left-to-right, top-to-bottom. Note that I did not tone-map or account for changes in overall exposure (so the specular reflections can appear blown-out, especially for the higher blurs). After the break, you can see the effect using different light probes (and different shapes).

Read More

Misperceived axis of rotation for objects with specular reflections

Katja Dörschner visited JLU last week and talked about her work investigating structure from motion with specular reflections and textures (see more info in her recent paper: Doerschner, Fleming, Yilmaz, Schrater, Hartung, & Kersten, 2011). She showed an interesting situation where the axis of rotation of a 3D teapot was misperceived due to the motion of the specular reflections on the surface of the teapot (see: Yilmaz, Kucukoglu, Fleming, & Doerschner, 2011), an effect first demonstrated by Hartung and Kersten (2002).

Using the OpenGL/Psychtoolbox framework I have previously described, I replicated this interesting effect. When you play the following movie, a 3D sphere (with sinusoidal perturbations) is rotated. Note the axis of perceived rotation when the object has specular reflections (1st half of the movie) and when the environment map is “painted” onto the surface (2nd half of the movie).


The physical motion of the object is the same in both cases — the object rotates around the vertical axis. When the object only has specular reflections, it appears to rotate around an oblique 45° axis, but when textured it rotates around the vertical axis. After the break, I show similar effects when the object is rotated around the horizontal axis, 45° axis, and when the spatial frequency of the perturbation is manipulated.

Read More